Difference in R&D spending across neighbouring countries
The R&D spending rate currently stands at 3.1% in Germany and 3.5% in Belgium. By actively focusing on increasing R&D spending over the past 20 years, both Belgium and Germany met the EU target by 2019 and 2016 respectively (see Figure 1).
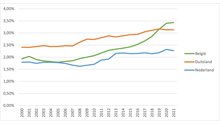
Figure 1: Total R&D spending by the Netherlands, Belgium and Germany (GERD/GDP [%]). Source: Eurostat, 2023.
The difference in spending between the Netherlands and Belgium is particularly striking. While both countries spent around 2% of GDP on R&D at the turn of the century, Belgium shows steady growth since 2005. For the Netherlands, the picture is more volatile: from a decline to an increase to a longer stabilisation. In the years following the outbreak of the 2008 financial crisis and the subsequent great recession and European debt crisis, the three neighbouring countries clearly made different choices regarding R&D investment.
Public R&D funding in comparison
A country's overall R&D spending is largely influenced by how funding is structured nationally. Further TNO analysis of public R&D spending was measured using government budget allocations for R&D (GBARD).
GBARD provides insight into direct public funding of R&D, as included in a country's government budget. Figure 2 shows that direct public funding of R&D in the Netherlands has doubled since the Lisbon standard of 3% of GDP was set in 2000. At the beginning of this century, growth of Dutch GBARD roughly parallels the increase in total government spending.
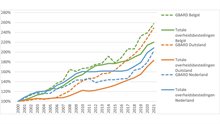
Figure 2: Development in government budget allocations for R&D (GBARD) and total public spending in the Netherlands, Germany and Belgium from 2000. Source: Eurostat and OECD, 2023.
But from the outbreak of the financial crisis in 2008, this form of public financing lagged behind the trend in overall public spending. After 2017, the Netherlands opted for a substantial increase again. In contrast, Belgium and Germany decided to focus heavily on public R&D funding in the 2009-2017 period and its growth has been 50% stronger than in the Netherlands.
National Growth Fund
A significant part of the increase in Dutch R&D spending in recent years has to do with the National Growth Fund (NGF). The NGF is currently the main instrument for long-term public-private investment in innovation in certain fields. On average, this fund provides around 0.2% of GDP annually in additional public funding for R&D.
Without further policies, there is a risk this fund could dry up from 2025/2026. This poses a risk to the Netherlands' future earning potential, as this spending stimulates new businesses, helps existing ones grow and contributes to the creation of wealth and well-being.
Questions? Contact us
-

Lotte de Groen
Functie:Market directorSpecialisatie niet bekendMy name is Lotte de Groen. I am market director at TNO Vector, where I operate at the strategic intersection of societal transitions, innovation, and market development. In this role, I focus on accelerating and scaling transitions that have a tangible impact on long-term competitiveness, societal resilience, and broad prosperity.
-
E-mail:E-mail Lotte
-
LinkedIn:Lotte on LinkedIn
-